The Long Term ST Database (LTST DB) is being developed by the joint efforts of our research groups in Ljubljana, Pisa, and Cambridge. It is planned to contain up to 70 annotated 2-channel records, each 24 hours in duration, obtained from AECG recordings. These will include approximately 30 of the 90 24-hour recordings from which the two-hour excerpts in the ESC DB were obtained. The records have been selected to represent ``real world'' data as much as possible, while documenting significant numbers of ischemic and non-ischemic ST events. The annotation protocol is compatible with that developed for the MIT-BIH Arrhythmia and ESC Databases, but we have extended it to permit more detailed descriptions of non-ischemic ST events.
We obtain accurate human annotations of ST events using special-purpose interactive editing software developed by the FCIS group in Ljubljana, and using the general-purpose WAVE software system developed by the second author[4]. Each record also includes a compact clinical summary, with technical information about the recording as well as relevant clinical information (e.g., electrolytes, medications, and pathology). When complete, the database and associated utility software will be published on CD-ROMs in the standard MIT-BIH format, as also used for the ESC DB.
The recordings chosen for the original ESC DB were selected to include examples of baseline ST displacement resulting from conditions such as hypertension, ventricular dyskinesia, and effects of medication. From these recordings, we will include in the LTST DB those originally recorded by the ICP group.
In addition, we are selecting new AECG recordings from those obtained
in routine clinical practice at Boston's Beth Israel Hospital (BIH)
and at the ICP. Each selected recording must contain significant
(![]() 100
100![]() V) transient ST segment episodes corresponding to known or
suspected ischemia, significant non-ischemic ST episodes, significant
slow ST level drift, or mixed episodes. Recordings containing
combinations of these events are preferred.
V) transient ST segment episodes corresponding to known or
suspected ischemia, significant non-ischemic ST episodes, significant
slow ST level drift, or mixed episodes. Recordings containing
combinations of these events are preferred.
Both sets of analog recordings have been made using standard AECG recorders (the model of recorder used is documented in each case). The analog outputs of the playback units are passed through antialiasing filters and digitized. Since none of the AECG recorders preserves frequency content in the signals above about 45 Hz in the best cases, and closer to 30 Hz in typical cases, we digitize the records at 125 samples per second per channel. There is simply no additional information to be gained from using a higher sampling frequency for these recordings. The resolution is 12 bits, and the amplitude scale is 200 ADC units/mV for all signals.
As for the ESC DB, we defined ST deviation as a change in ST level relative to a reference level. Since some recordings exhibit fixed ST depression relative to the isoelectric level (due to prior infarcts, for example), it is not meaningful to define the significance of transient ischemic change in terms of ST amplitude (ST level relative to the isoelectric level) in these recordings. We identify the reference ST level by searching for a five-minute interval without significant variation in ST level as near as possible to the beginning of the record. Within this interval, a reference beat is selected and annotated for each ECG lead. The ST levels of these beats become the reference ST levels.
We define and annotate events independently on each channel, retaining the ESC DB's definition of significant ST episodes:
Any significant event in the LTST DB must meet these criteria. The events of interest are ischemic episodes, non-ischemic episodes and episodes of slow ST level drift. Ischemic episodes typically exhibit a distinctive triangular pattern of ST deviation over time.
Based on our previous studies, we defined characteristics for non-ischemic episodes resulting from position-related (postural) changes in the cardiac electrical axis:
Axis shifts are best observed in time series of QRS morphology features.
Slow ST level drift is the most difficult event to recognize,
especially if no other ischemic episodes are present. Drift may
result from slow (non-postural) changes in the cardiac electrical
axis, effects of medication on repolarization, or effects of changes
in heart rate on repolarization. Since the cumulative effect of drift
over periods ranging from 10 minutes to several hours may amount to a
significant change of ST level (100![]() V or more), it cannot be
ignored. Drift episodes are best identified from ST trend plots.
Based on our previous studies, and the data at hand, we identify a
drift episode as a significant ST episode that meets any of the following
criteria:
V or more), it cannot be
ignored. Drift episodes are best identified from ST trend plots.
Based on our previous studies, and the data at hand, we identify a
drift episode as a significant ST episode that meets any of the following
criteria:
In clinical practice, there is usually evidence independent of the ECG
to support a diagnosis of ischemia. Hence it is likely that criteria
such as those described above will miss events of borderline
significance that would be considered ischemic in light of additional
non-ECG evidence. To account for these events, we also annotate
episodes for which the maximum ST deviation is nearly 100![]() V, and
which meet all of the other criteria for ischemic episodes. These are
annotated as borderline plus or minus (respectively, with or without
ST morphology change). Another category of events of borderline
significance (borderline minus) is that satisfying the criteria
described above but without ST morphology change.
V, and
which meet all of the other criteria for ischemic episodes. These are
annotated as borderline plus or minus (respectively, with or without
ST morphology change). Another category of events of borderline
significance (borderline minus) is that satisfying the criteria
described above but without ST morphology change.
Various significant mixed (compound) episodes require special
treatment. This category includes non-ischemic episodes containing
ischemic ``sub-episodes,'' and drift episodes containing ischemic or
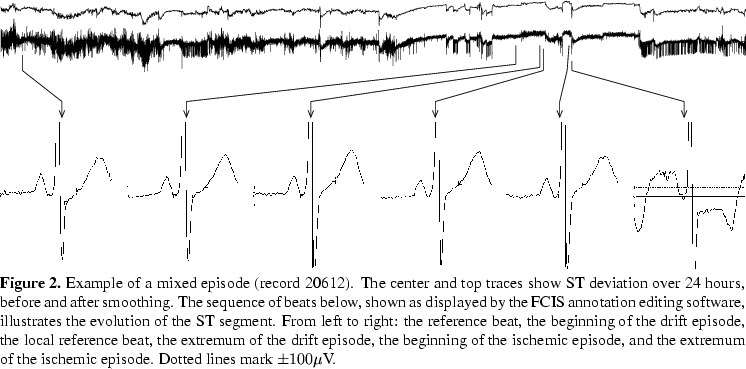
non-ischemic sub-episodes. Figure 1 schematically shows such a mixed
episode. The general trend of ST deviation during a mixed episode is
more or less stable (typically between 100 and
200![]() V). While the boundaries of the mixed episode itself are
determined by ST deviations relative to the reference ST level from
the beginning of the record, those of the sub-episodes are
defined within the context of the mixed episode by local ST deviations
relative to a local reference beat. This local reference is selected and
annotated immediately after the beginning of each mixed episode.
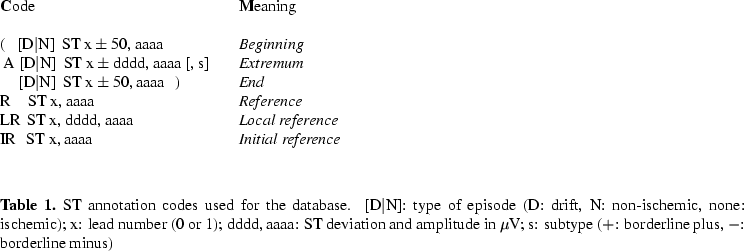
Each ST annotation contains both the ST deviation relative
to the initial (or local) reference, and the ST amplitude (deviation
relative to the isoelectric level). Except for reference beat
annotations, each ST annotation also contains information about the
type of episode to which it belongs.
V). While the boundaries of the mixed episode itself are
determined by ST deviations relative to the reference ST level from
the beginning of the record, those of the sub-episodes are
defined within the context of the mixed episode by local ST deviations
relative to a local reference beat. This local reference is selected and
annotated immediately after the beginning of each mixed episode.
Each ST annotation contains both the ST deviation relative
to the initial (or local) reference, and the ST amplitude (deviation
relative to the isoelectric level). Except for reference beat
annotations, each ST annotation also contains information about the
type of episode to which it belongs.
![\begin{figure}%%episode representation
\begin{picture}(330,85)(0,0)
\unitlength ...
...n here [R, LR, IR, (N, AN, (, A, ), and N)] are
defined in table 1.
\end{figure}](img7.png)
ST annotations are made manually with reference to the ECGs and to trend plots of heart rate and QRS and ST morphologic features. The trend plots[3] are produced using ARISTOTLE[5] for QRS complex detection and classification, followed by removal of baseline wander using a cubic spline approximation and subtraction technique, low-pass filtering by a 6-pole Butterworth filter (with a cut-off frequency of 55 Hz), and extraction of ST and QRS morphology features with heart rate. Next, the Ljubljana group's software for interactive ST analysis is used for rejecting abnormal beats and their neighbors, filtering of the feature time series (see figure 2, center trace), resampling, and smoothing (figure 2, top trace). This approach makes use of the representation power of the KLT series, while compact trend plots assure accurate detection of important as well as subtle events in the series [3]. Events are visually detected after the final preprocessing step. Annotations are made directly on the trend display (at user-selected scales from 2 minutes to 24 hours) after noise detection in the KLT space, with reference to the original ECG signals in the region of interest displayed using the WAVE system.
In the final phase of annotating, the exact locations of the ST annotations are determined by visual comparison of each clean beat of the original ECG signals in the region of an ST event with the reference beat at high resolution (see figure 2 at bottom). This requires manual determination of the isoelectric level and J point for each beat under consideration. As for the ESC DB, the ST segment amplitude and ST deviation level (according to the reference beat) are measured 80ms after the J point (or 60ms after the J point if the heart rate exceeds 120 bpm). The database will also include semi-automated measurements of ST amplitude at both J+60ms and J+80ms for each beat.
As of August, 1996, we had collected and digitized 50 24-hour records: 30 at BIH, 20 at the ICP. These 50 records have been preprocessed and 15 of them annotated by the FCIS group, and subsequently verified and corrected by a cardiologist. These 15 records contain 179 ischemic, 40 non-ischemic, 7 drift, and 10 mixed episodes.
The Ljubljana group's interactive ST analysis software is being developed in parallel with the database. Although the current version has been used in the annotation of 15 records, planned improvements should permit greater efficiency in the remaining work.